Disney Compass
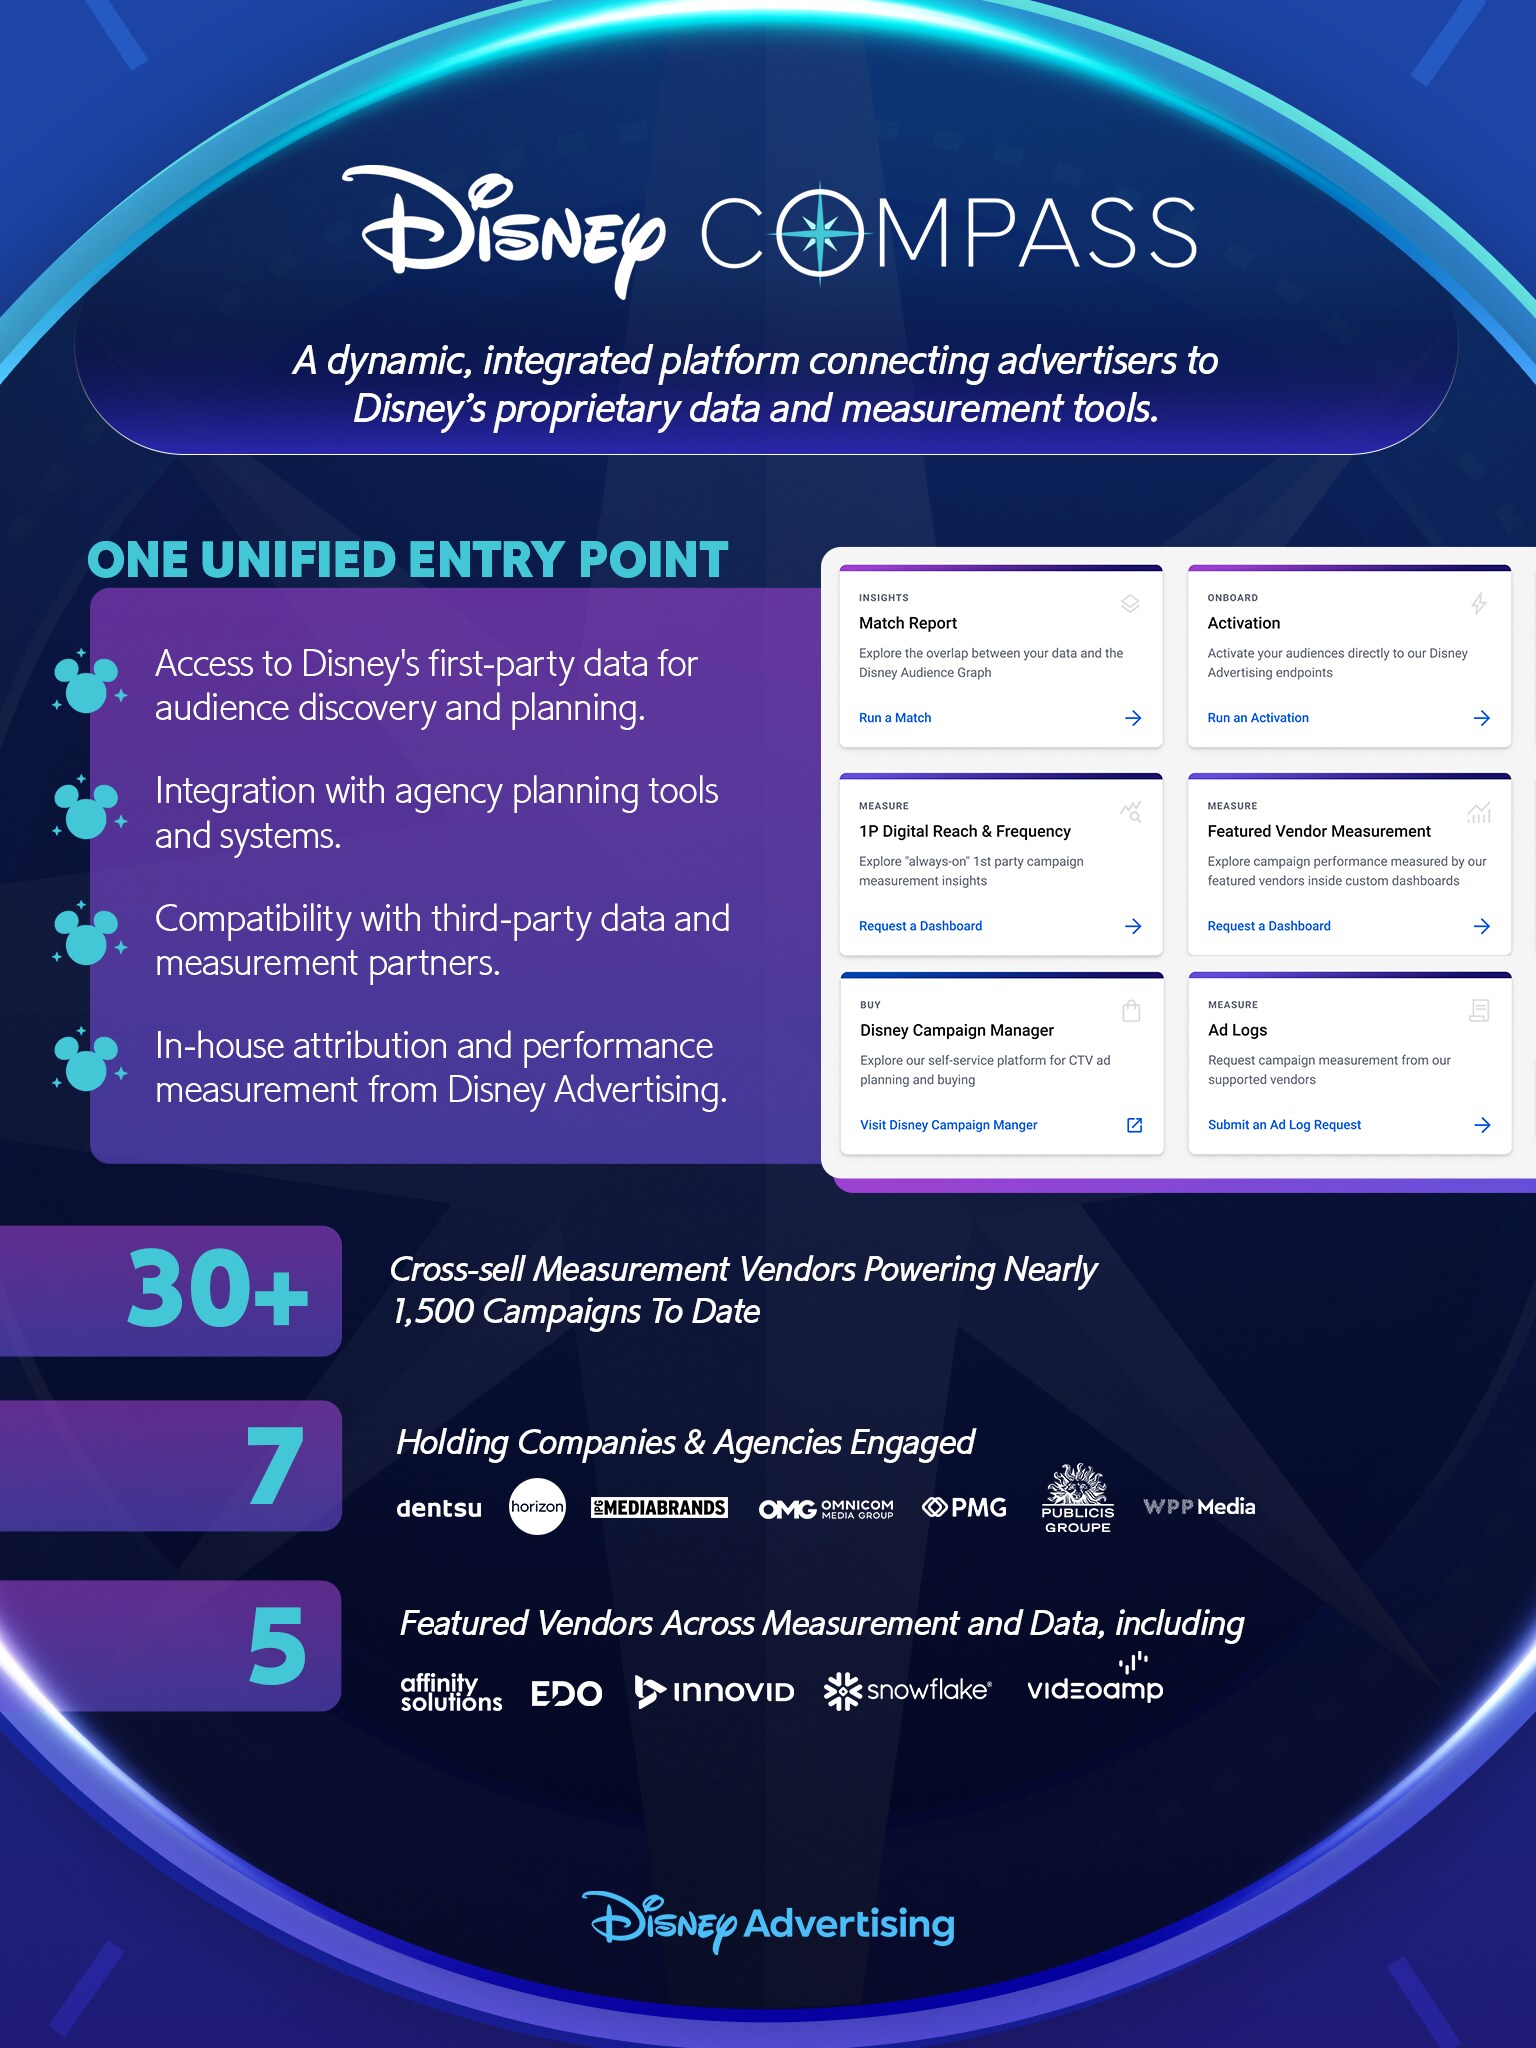
We created a unified data platform that gives advertisers a hub to access Disney's first-party audience data, campaign planning and performance measurement tools, replacing a fragmented workflow that required advertisers to work across multiple disconnected vendors' tools.
Disney Compass
When our team started, Compass did not yet exist. It was exciting to create a product from the ground up! I was the UX lead, working alongside a creative director and a UI lead (as well as engineering and product partners). I had the opportunity to create initial information architecture, flows, screens, data visualization and other associated UX.

Selected Artifacts
Sitemap
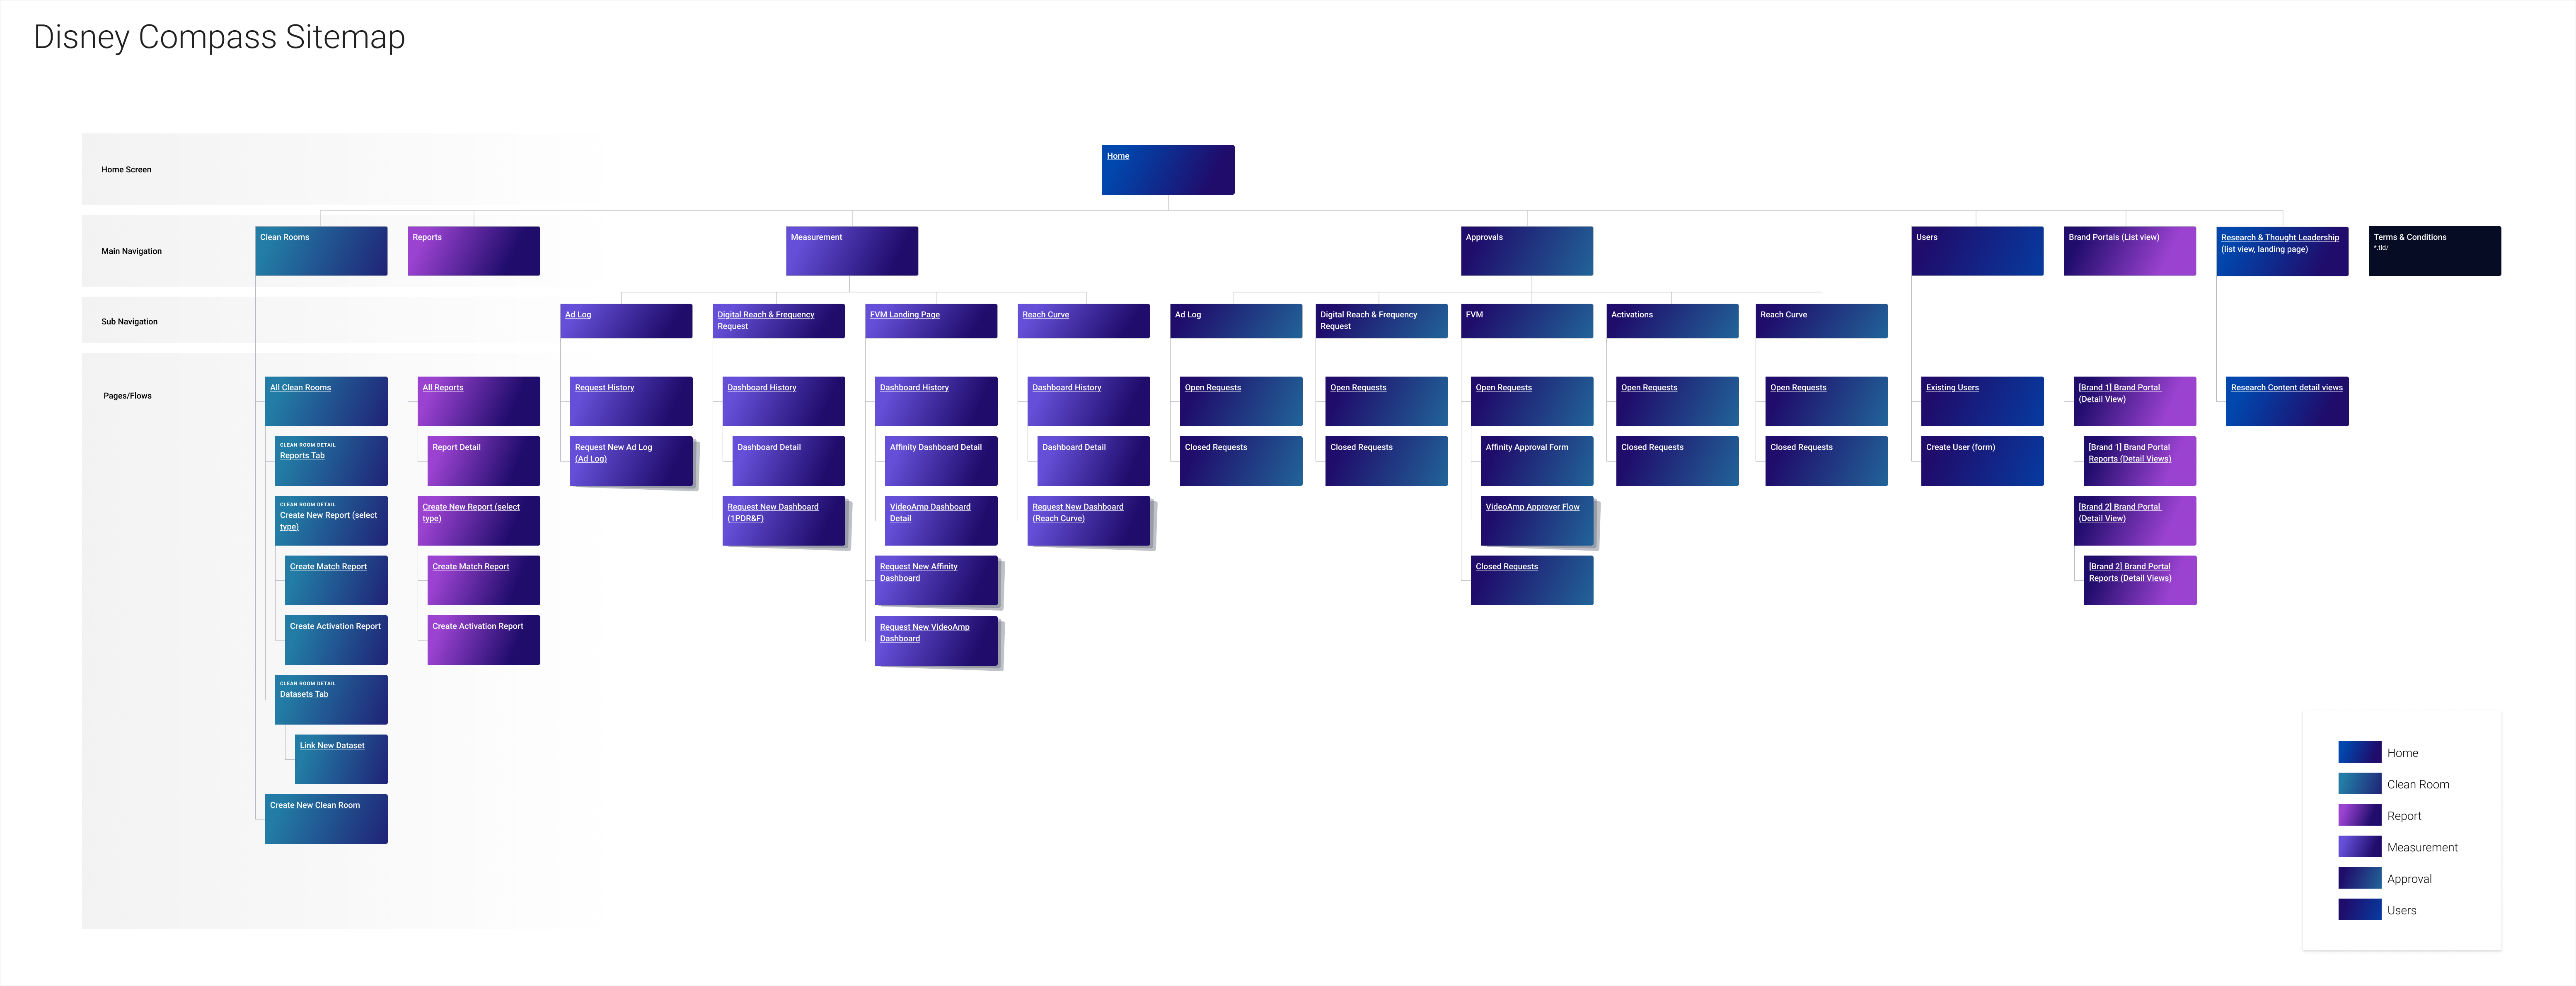
Based on the required features defined by the product team, I created the sitemap. This is the final version we arrived at after many iterations.
Selected Artifacts
Pre-Activation Report
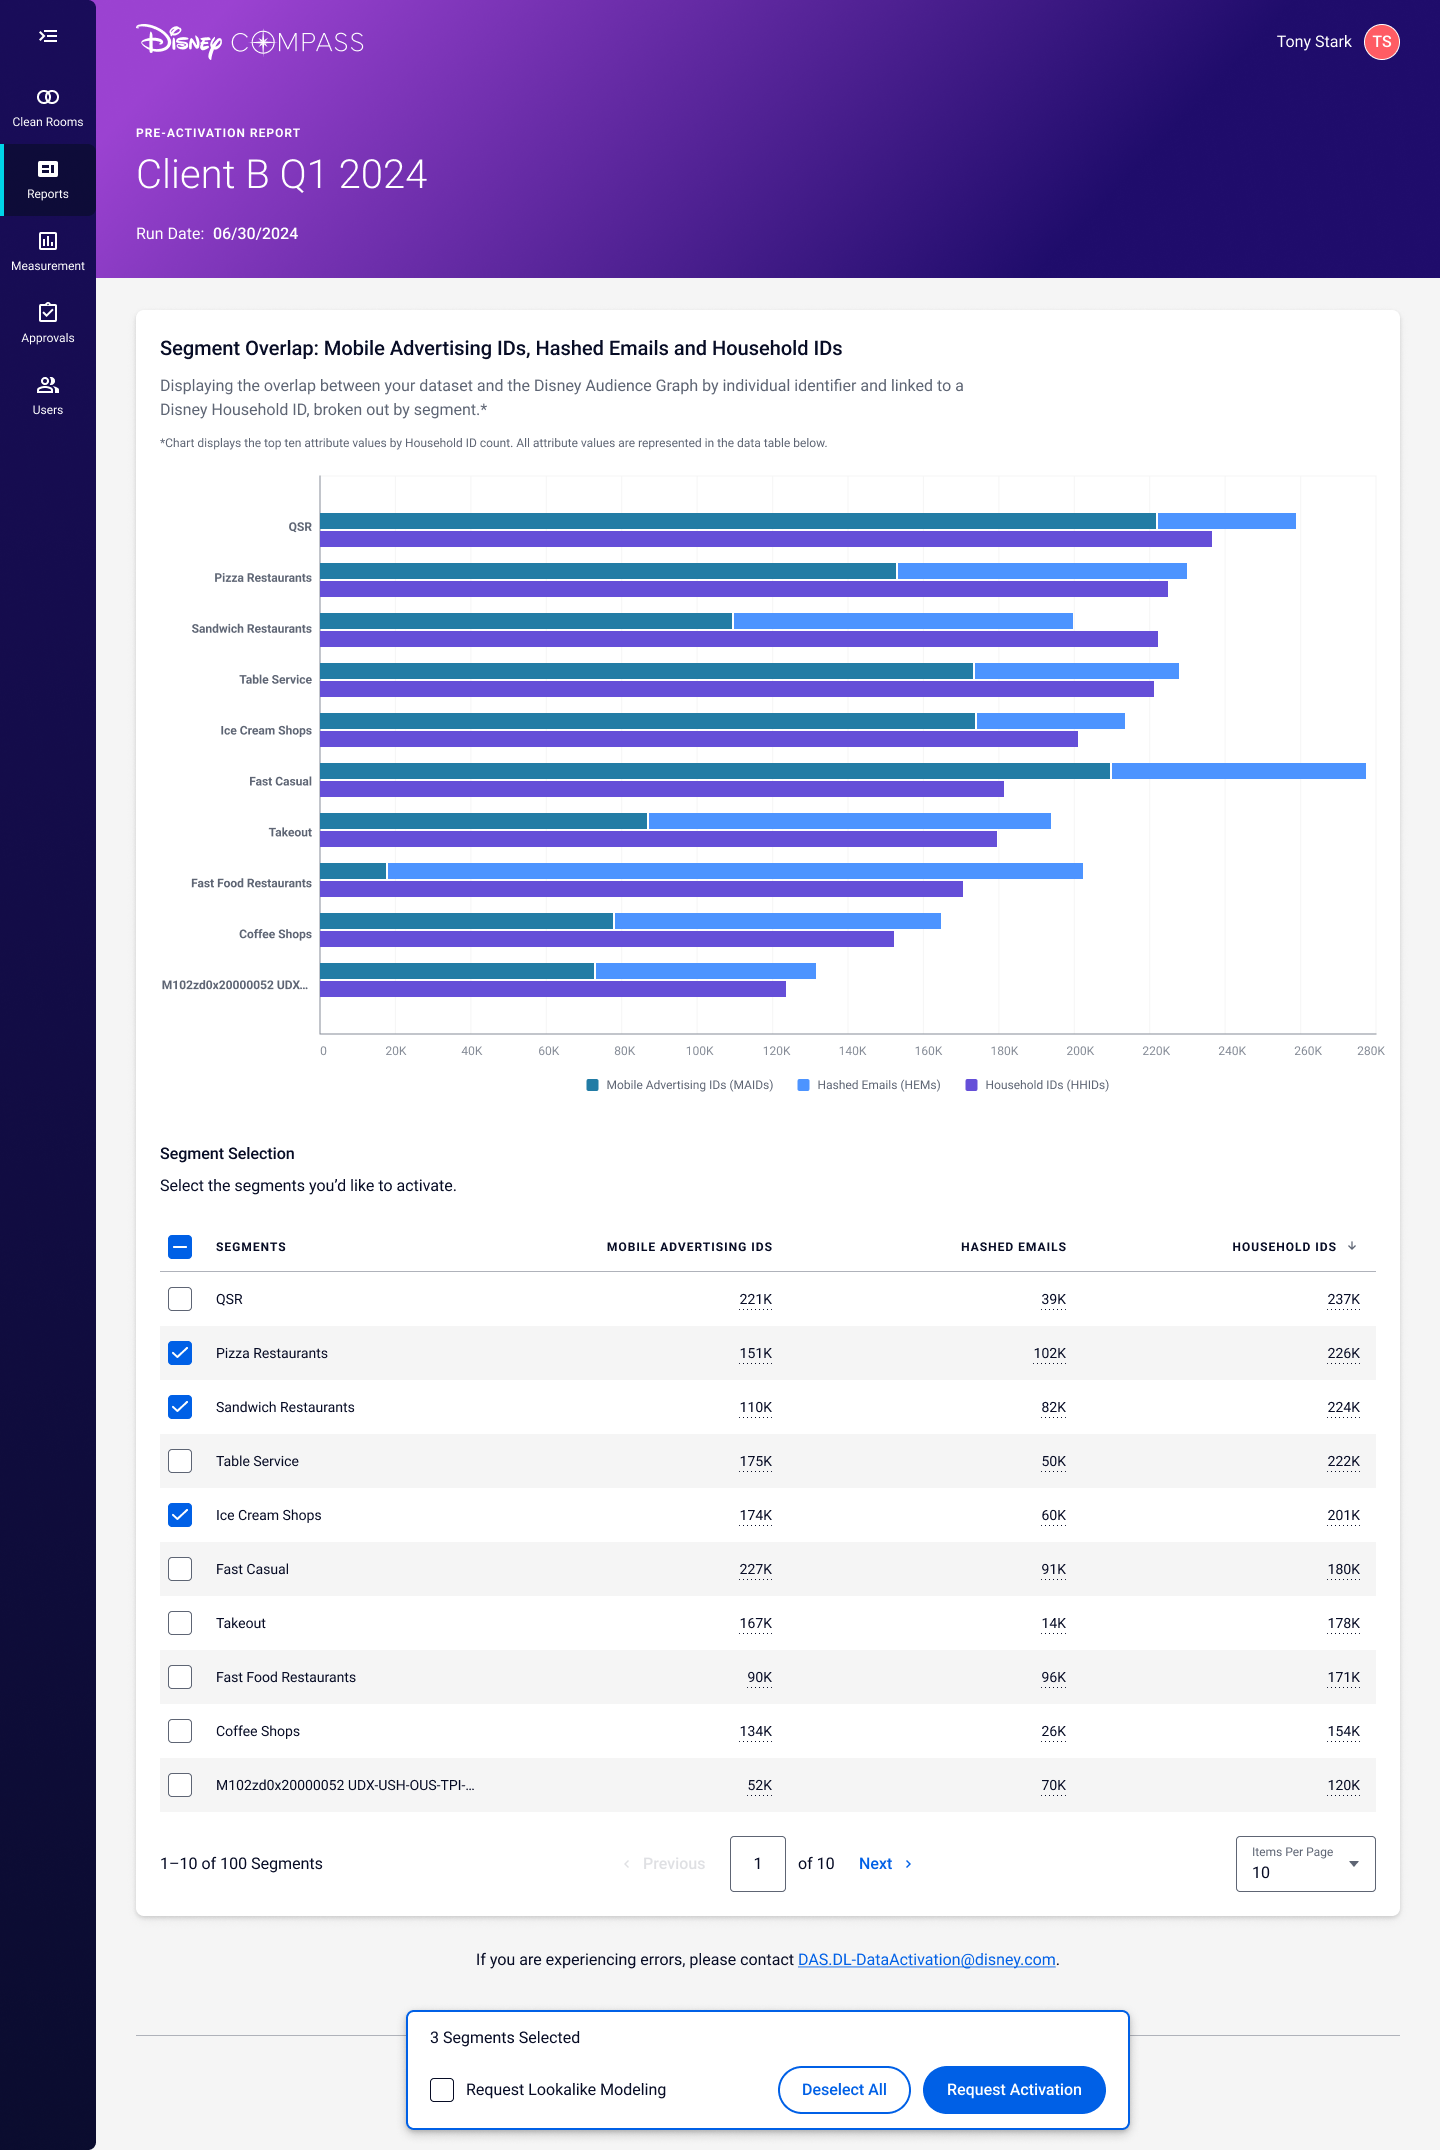
For many screens including this one, I created everything except the visual design direction.
I created a custom stacked bar chart variant to communicate the required information. The selection modal seen at the bottom of the page is only present if the user has selected an item from the table.
Selected Artifacts
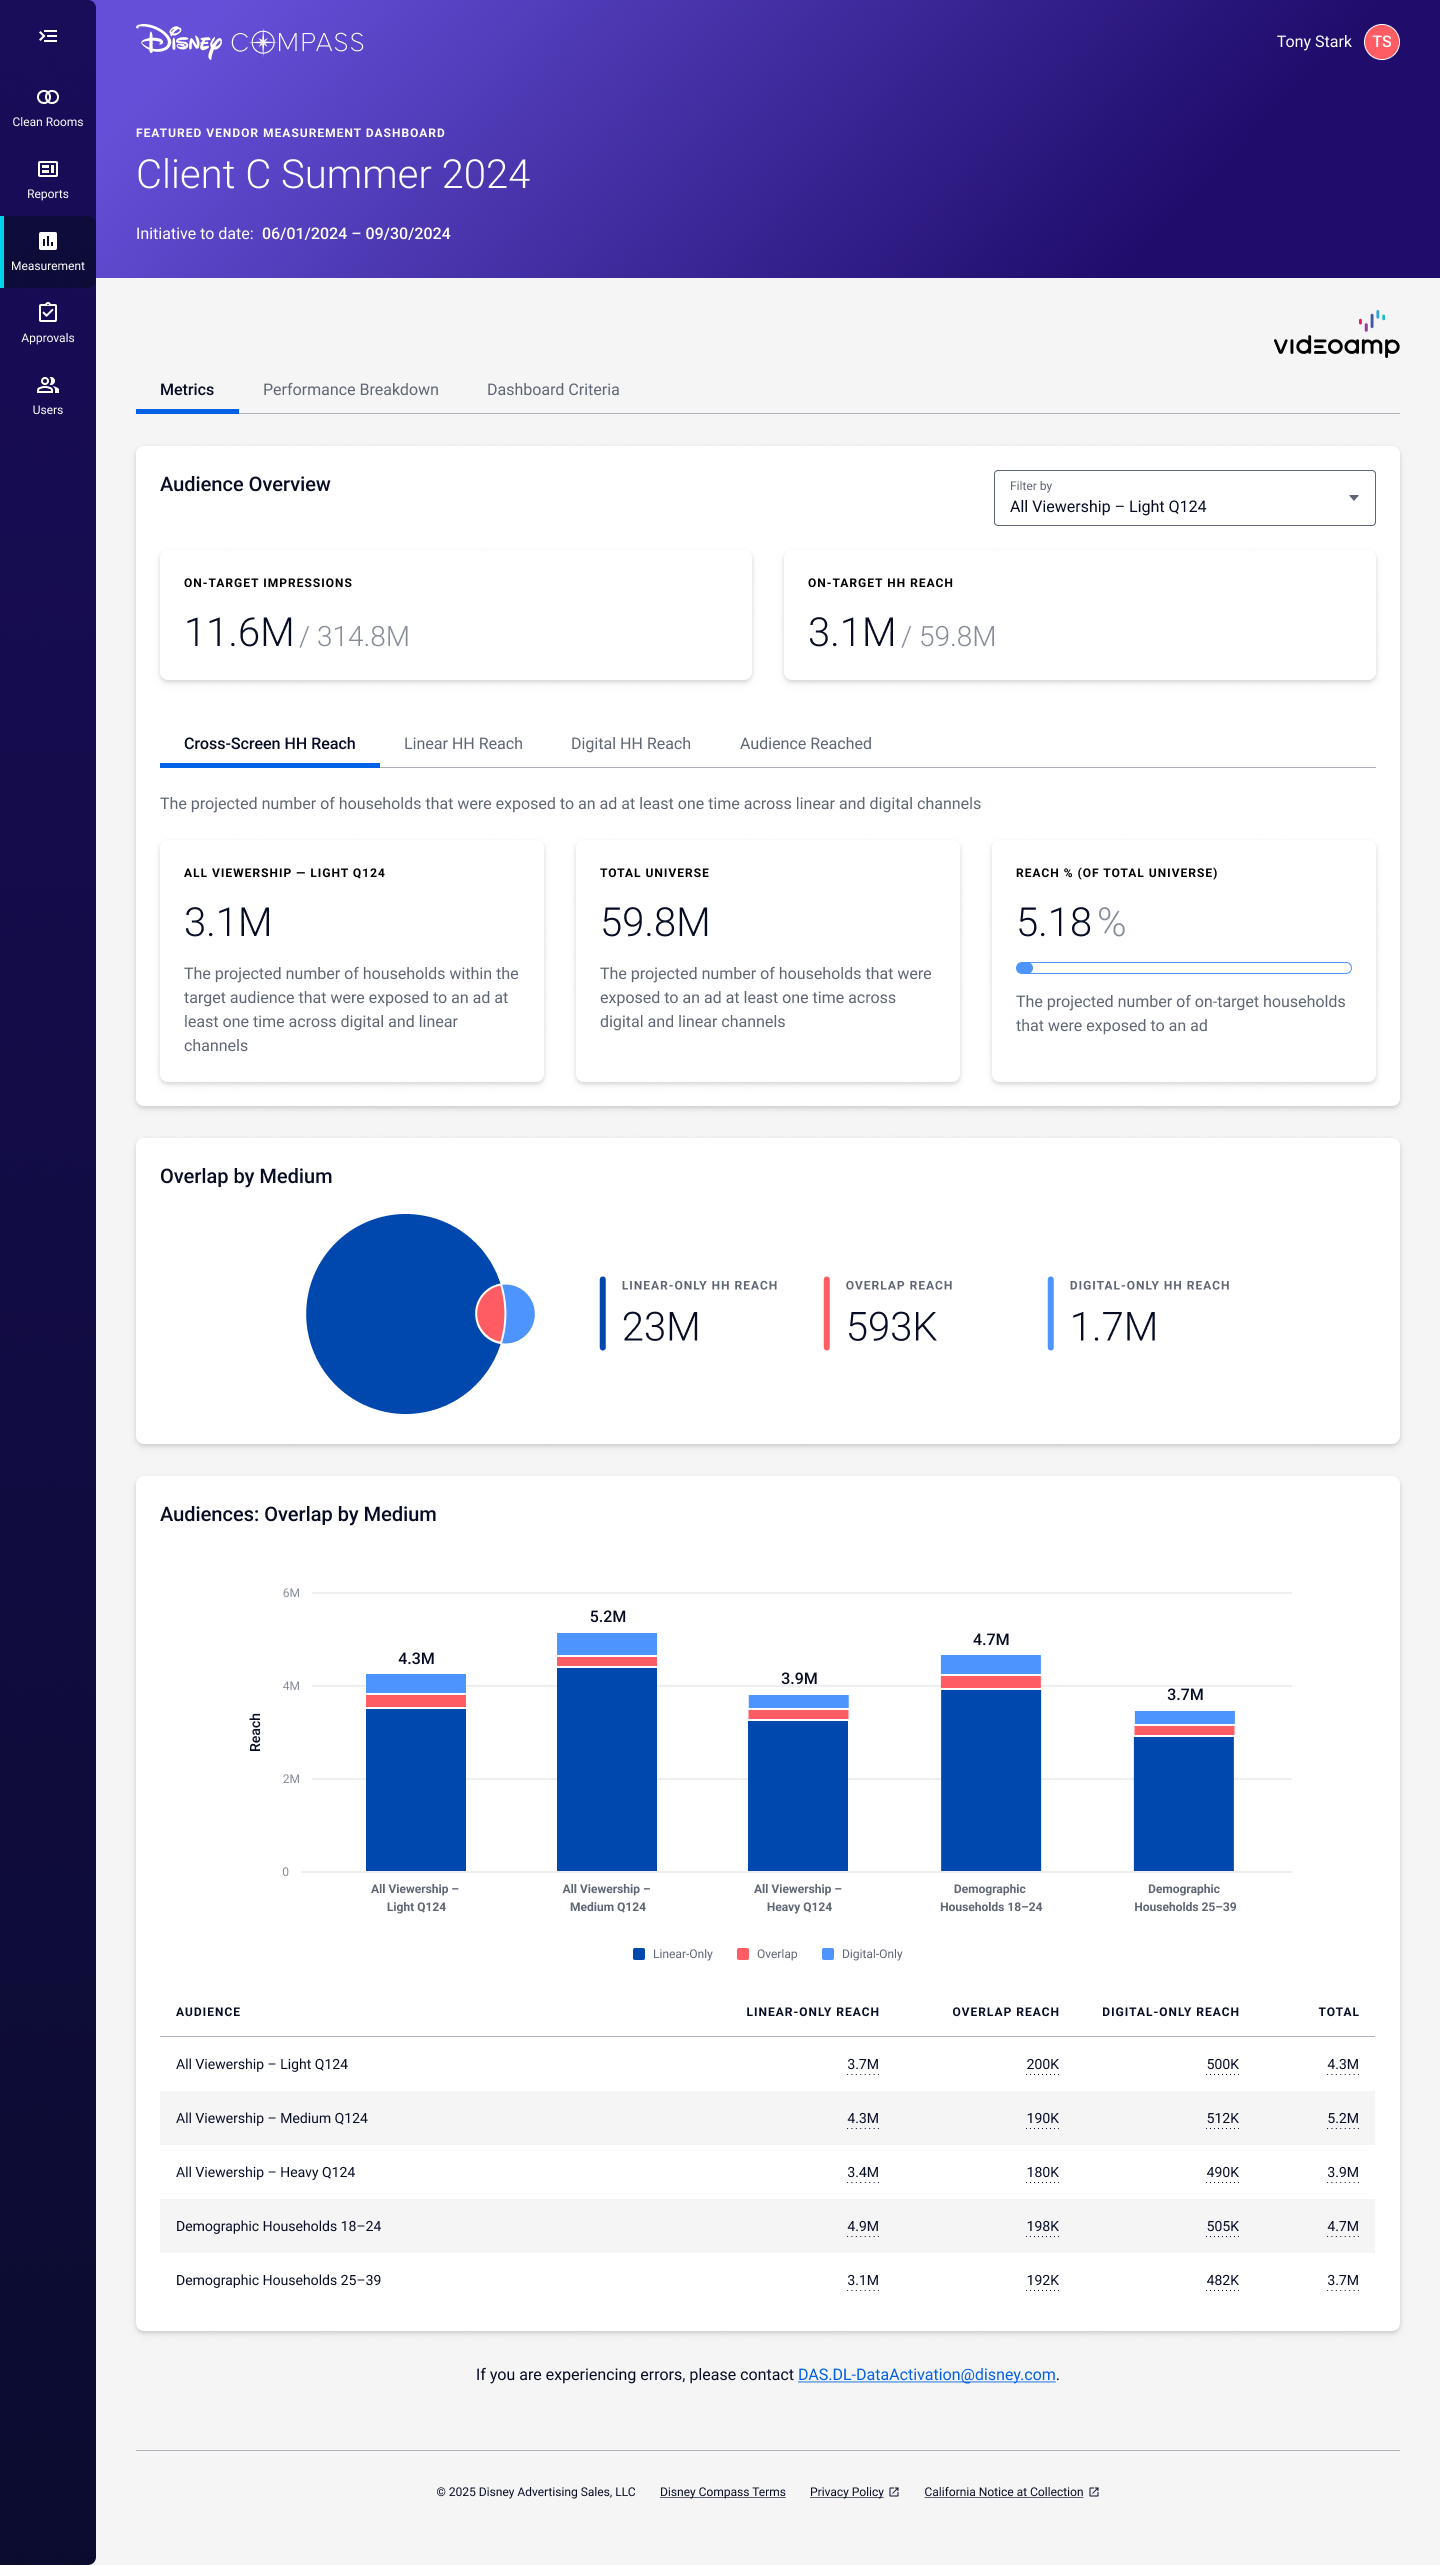
Measurement Dashboard
In an effort to avoid users drilling down many pages in the experience and getting lost, I proposed we use as flat a structure as possible, utilizing tabs wherever it made sense. Special attention had to be paid to any page that showed data - we made every effort to only show key information on pages with lots of it.
Selected Artifacts
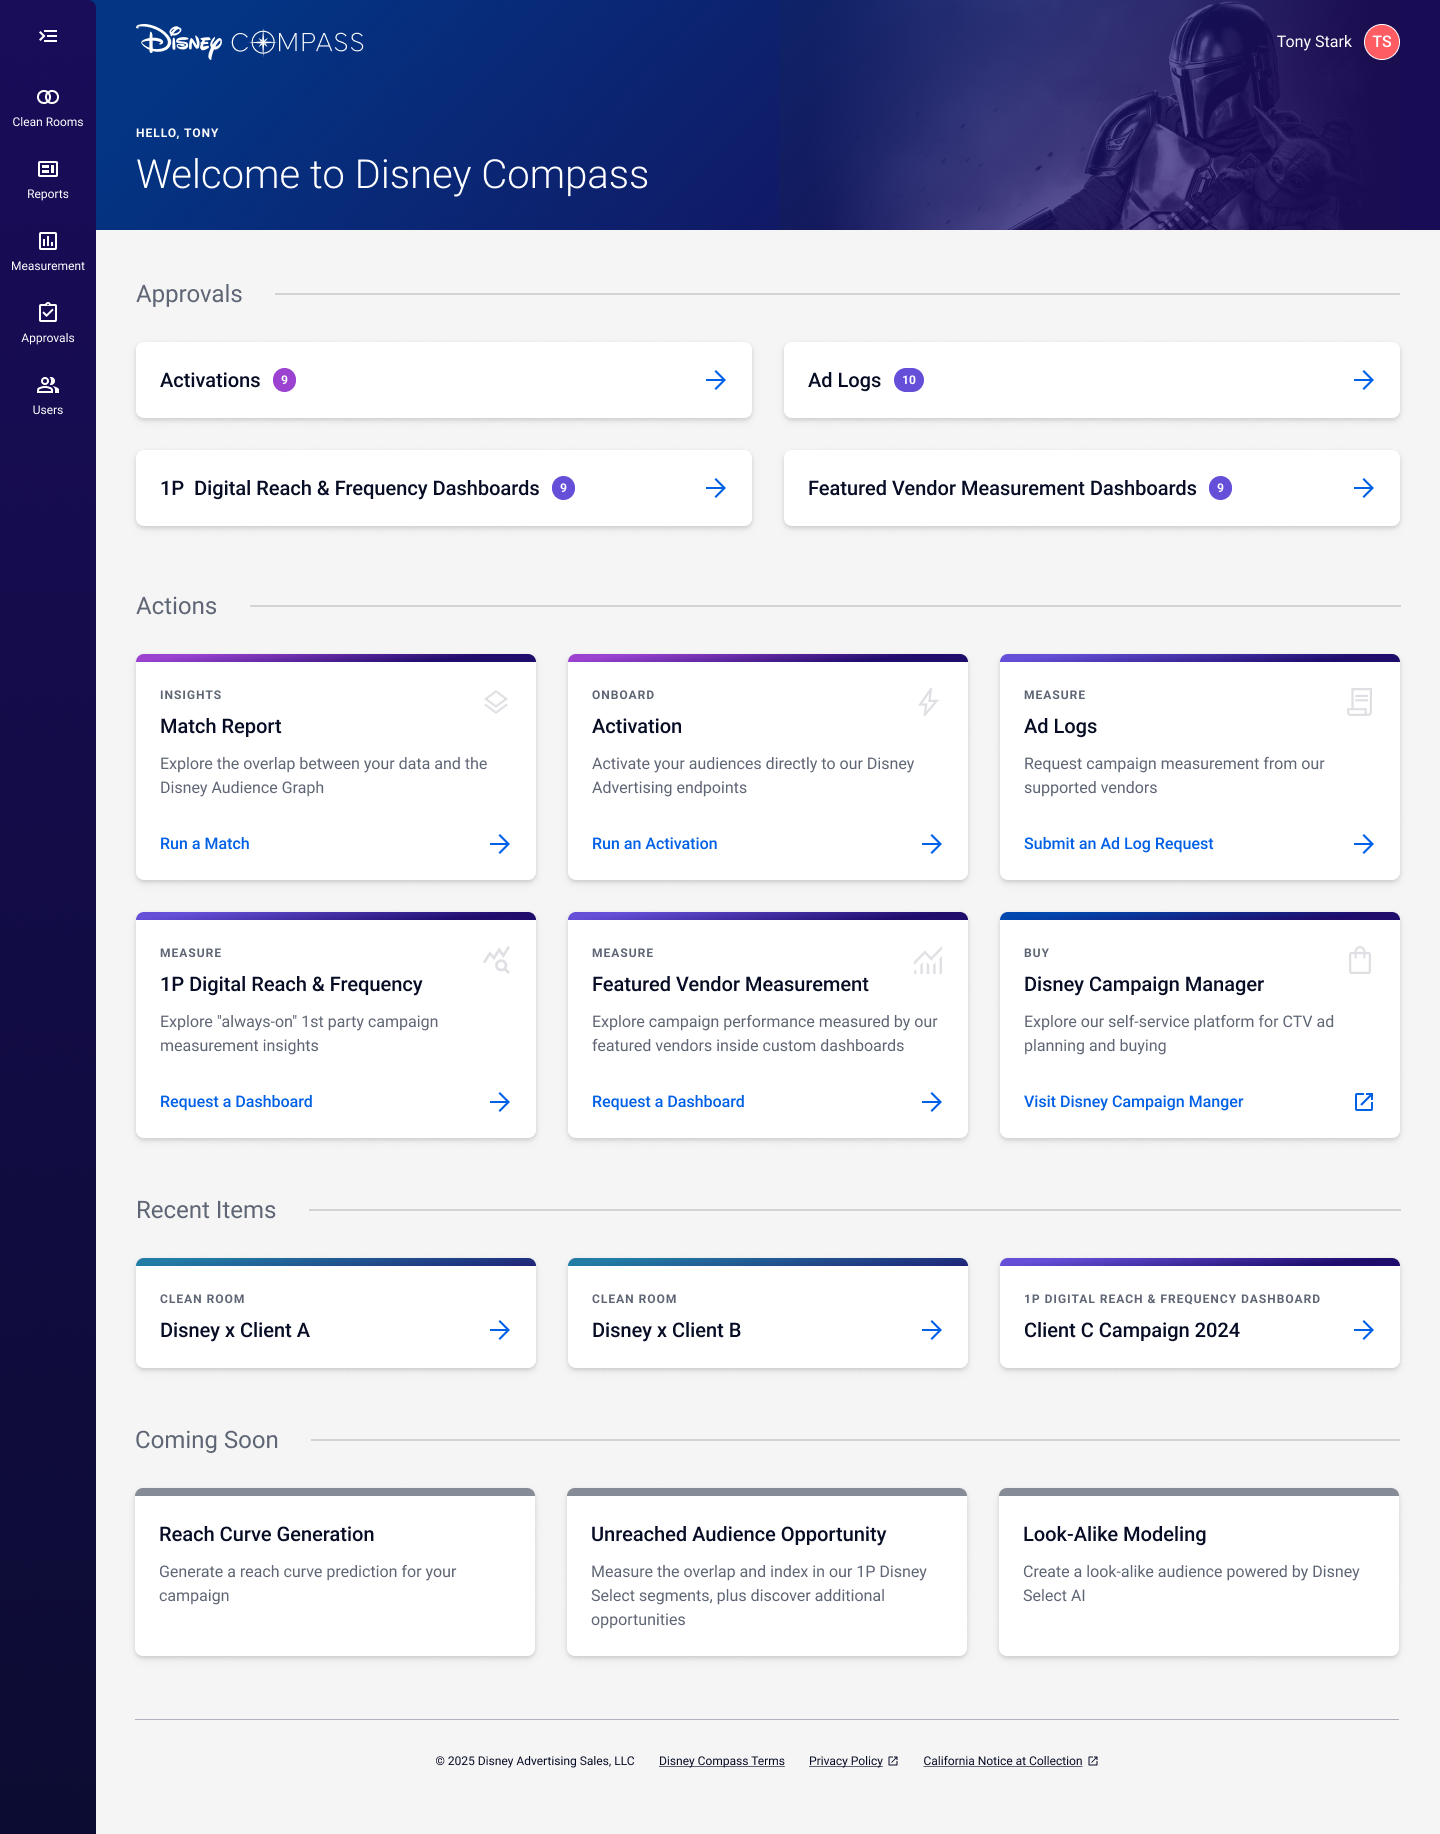
Home Page
The home page gives users a glance into what needs to be done, then actions that can be done. While there are certainly more actions that users can complete, we worked to only include necessary ones on the home page - if there were too many, it the page would quickly become overwhelming.